Client Profiling: Difference between revisions
From Eco - English Wiki
| [checked revision] | [checked revision] |
m Dennis moved page Performance Profiling to Client Profiling without leaving a redirect: We already had a page for server profiling. |
Changed to client profiling only, added new profiling methods. |
||
| Line 1: | Line 1: | ||
== | ==General Profiling== | ||
In a development build you can use the `F6` key to make a snapshot. Check the chat log for output file location details. | |||
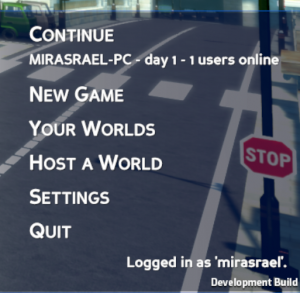
' | You can check if you're running a development build by looking up if this message is present in the right bottom corner: | ||
[[File:Development build.png|none|thumb]] | |||
[[File: | |||
== Transforms Profiling == | |||
. | # Open Diagnostic Pages UI (with F2). | ||
# Go to Transforms page (navigate pages with F3/F4). Page itself significantly impacts performance so keep it closed when you don't need transform updates data. | |||
# When you have FPS problems open the page, wait for few seconds and make a screenshot. Attach it to report. | |||
# Then run /savetransformstats command in console, find in same directory as Player.log file named transform-stats..txt and also attach it to report. | |||
== Test which objects have the most performance impact == | |||
# Use /disableobjects {trees,animals,worldobjects,rubbles} (one of the options) to disable rendering of specific group of objects. Then you can check if it fixes your FPS or not. You can also test if with that group disabled you have performance degradation issues or not. | |||
# Use /enableobjects all (or speicific group you previously disabled) to re-enable all objects. Though all objects which was previously disabled won't be recovered - you need to re-enter the world or reload these objects by leaving and returning to the area. | |||
You can | |||
Revision as of 12:08, 15 November 2022
General Profiling
In a development build you can use the `F6` key to make a snapshot. Check the chat log for output file location details.
You can check if you're running a development build by looking up if this message is present in the right bottom corner:

Transforms Profiling
- Open Diagnostic Pages UI (with F2).
- Go to Transforms page (navigate pages with F3/F4). Page itself significantly impacts performance so keep it closed when you don't need transform updates data.
- When you have FPS problems open the page, wait for few seconds and make a screenshot. Attach it to report.
- Then run /savetransformstats command in console, find in same directory as Player.log file named transform-stats..txt and also attach it to report.
Test which objects have the most performance impact
- Use /disableobjects {trees,animals,worldobjects,rubbles} (one of the options) to disable rendering of specific group of objects. Then you can check if it fixes your FPS or not. You can also test if with that group disabled you have performance degradation issues or not.
- Use /enableobjects all (or speicific group you previously disabled) to re-enable all objects. Though all objects which was previously disabled won't be recovered - you need to re-enter the world or reload these objects by leaving and returning to the area.