Client Profiling: Difference between revisions
| [checked revision] | [checked revision] |
| Line 1: | Line 1: | ||
==Server profiling== | ==Server profiling== | ||
Server profiling is available in release build both for memory and CPU. For CPU profiling it takes a 1 minute snapshot, for memory it makes a dump file. | Server profiling is available in release build both for memory and CPU. For CPU profiling it takes a 1 minute snapshot, for memory it makes a dump file. | ||
'''During creation of the snapshot it is expected to have increased CPU usage, which may cause in game lags.''' | |||
===Requirements=== | ===Requirements=== | ||
1. For dotnet trace CPU snapshots: https://docs.microsoft.com/en-us/dotnet/core/diagnostics/dotnet-trace#install | 1. For dotnet trace CPU snapshots: https://docs.microsoft.com/en-us/dotnet/core/diagnostics/dotnet-trace#install | ||
| Line 20: | Line 21: | ||
===Output results=== | ===Output results=== | ||
All profiling results are stored in the Server/ProfilingResults directory. You can check the exact log path in the server log. Results are saved as .zip file and may need to be extracted first. | All profiling results are stored in the Server/ProfilingResults directory. You can check the exact log path in the server log. Results are saved as .zip file and may need to be extracted first. | ||
.dtt - can be opened JetBrains dotTrace | .dtt - can be opened JetBrains dotTrace | ||
.dmp - Memory dump, can be opened with JetBrains dotMemory, WinDbg or VisualStudio | .dmp - Memory dump, can be opened with JetBrains dotMemory, WinDbg or VisualStudio | ||
Results may be accessed via the Web UI as well. It requires admin user permissions (using | .nettrace - can be opened with PerfView or converted to SpeedScope format. | ||
Read more: https://github.com/dotnet/diagnostics/blob/main/documentation/dotnet-trace-instructions.md#viewing-the-trace-captured-from-dotnet-trace. | |||
Results may be accessed via the Web UI as well. It requires admin user permissions (using ''/profiler results'' command). | |||
==Client Profiling== | ==Client Profiling== | ||
In the development build you can use the `F6` key to make a snapshot. Check the chat log for output file location details. | In the development build you can use the `F6` key to make a snapshot. Check the chat log for output file location details. | ||
Revision as of 08:14, 15 November 2022
Server profiling
Server profiling is available in release build both for memory and CPU. For CPU profiling it takes a 1 minute snapshot, for memory it makes a dump file.
During creation of the snapshot it is expected to have increased CPU usage, which may cause in game lags.
Requirements
1. For dotnet trace CPU snapshots: https://docs.microsoft.com/en-us/dotnet/core/diagnostics/dotnet-trace#install
2. For memory dumps: https://docs.microsoft.com/en-us/dotnet/core/diagnostics/dotnet-dump#install
3. For JetBrains dotTrace snapshots: https://www.jetbrains.com/help/profiler/Performance_Profiling__Profiling_Using_the_Command_Line.html#install-and-use-the-command-line-tool-as-a-net-core-tool. For snapshot analysis it requires dotTrace license (trial available), but the snapshot itself can be done without license.
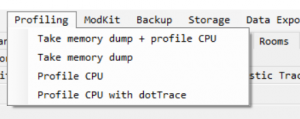
Server GUI
Snapshots can be made via the server GUI menu:

Chat Commands
May be invoked from game by a user with admin privileges. Mirrors GUI menu commands:
- /profiler full - both CPU (.nettrace) and memory snapshots **(Do not use - nettrace doesn't give insightful results)**
- /profiler dump - memory dump only
- /profiler cpu - CPU (.nettrace) snapshot only **(Do not use - nettrace doesn't give insightful results)**
- /profiler dottrace - dotTrace Timeline snapshot
- /profiler results - opens web page where profiling results may be downloaded
Output results
All profiling results are stored in the Server/ProfilingResults directory. You can check the exact log path in the server log. Results are saved as .zip file and may need to be extracted first.
.dtt - can be opened JetBrains dotTrace
.dmp - Memory dump, can be opened with JetBrains dotMemory, WinDbg or VisualStudio
.nettrace - can be opened with PerfView or converted to SpeedScope format.
Results may be accessed via the Web UI as well. It requires admin user permissions (using /profiler results command).
Client Profiling
In the development build you can use the `F6` key to make a snapshot. Check the chat log for output file location details.
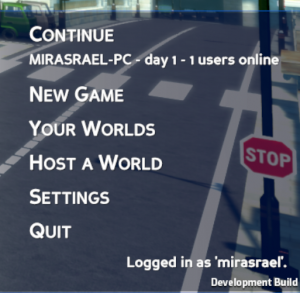
You can check if you're running a development build by looking up if this message is present in the right bottom corner:
