Server Profiling: Difference between revisions
| [checked revision] | [checked revision] |
No edit summary Tag: 2017 source edit |
No edit summary Tag: 2017 source edit |
||
| Line 1: | Line 1: | ||
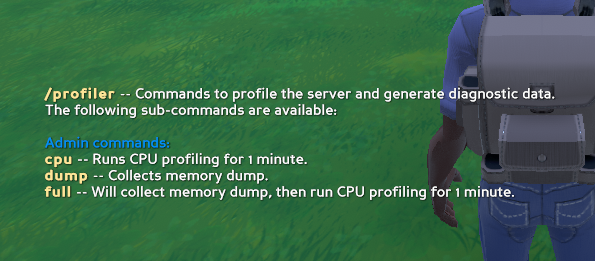
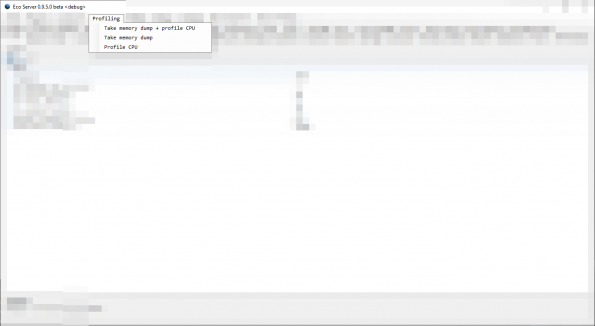
[[File:In-Game Profiling Commands.png|thumb|595x595px|In-game Admin commands that can be used to invoke profiling sessions|alt=]][[File:EcoServer Profiling Menu.png|thumb|595x595px|Various profiling options as seen in Server UI (Windows only)|alt=]]The profiling tools allow Server Owners and Admin to run profiling sessions to gather diagnostic data that is especially useful when the server is experiencing performance problems. | [[File:In-Game Profiling Commands.png|thumb|595x595px|In-game Admin commands that can be used to invoke profiling sessions|alt=]][[File:EcoServer Profiling Menu.png|thumb|595x595px|Various profiling options as seen in Server UI (Windows only)|alt=]]The profiling tools allow Server Owners and Admin to run profiling sessions to gather diagnostic data that is especially useful when the server is experiencing performance problems. | ||
You can use this generated data to complement issue reports for | You can use this generated data to complement issue reports for {{SLG}}. | ||
'''These instructions are valid for Update 9.6.4 and higher.''' | '''These instructions are valid for Update 9.6.4 and higher.''' | ||
Latest revision as of 07:28, 9 July 2024


The profiling tools allow Server Owners and Admin to run profiling sessions to gather diagnostic data that is especially useful when the server is experiencing performance problems.
You can use this generated data to complement issue reports for Strange Loop Games.
These instructions are valid for Update 9.6.4 and higher.
Requirements[edit | edit source]
For profiling to work, you need several prerequisites installed on your server:
dotnet-dump- to take memory dumps (see .NET Core diagnostic global tools and note that we don't use dotnet-trace, it doesn't provide useful output)dotTrace- to profile CPU
You have to make sure these are installed globally or available on your systems PATH so the server can run them.
Memory dumps[edit | edit source]
For when the server is consuming too much memory.
Memory dumps can be initiated by:
- As an admin, by issuing
/profiler dumpcommand - Invoking
Profiling -> Take memory dumpvia Server UI Menu (Windows only)
Memory dump will start the dotnet-dump process, taking a full snapshot of current memory as used by the server process and the file size will be proportional to that. For example, a server that is utilizing 2GB of RAM, the dump file generated will be also 2GB.
CPU profiling[edit | edit source]
For when the server is consuming too much CPU.
CPU profiling can be initiated by:
- As an admin, by issuing
/profiler cpucommand - Invoking
Profiler -> Profile CPUvia Server UI Menu (Windows only)
CPU profiling will start the dotTrace process, running it for 1 minute, capturing everything going on with the process for the time being.
Full profile[edit | edit source]
Full profile will simply take memory dump followed by CPU profiling, as if they were invoked in succession.